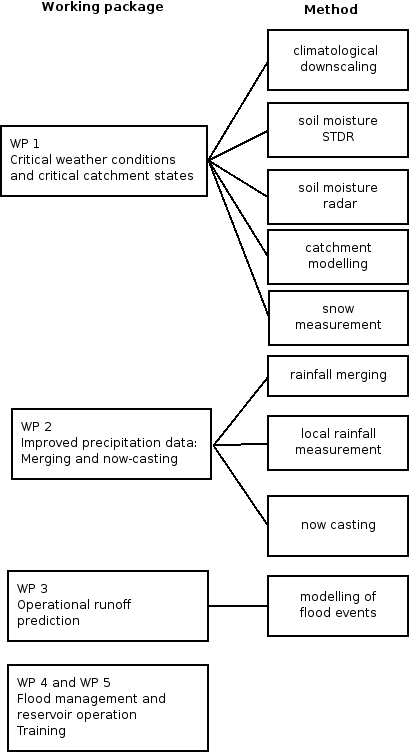
operational discharge and flooding predictions in head catchments
|
|
OPAQUE - |
Operationelle Abfluss- und Hochwasservorhersage in
Quellgebieten operational discharge and flooding predictions in head catchments |
In the hydrologic modelling the description of the initial condition of the
catchment area plays an important role at the beginning of a flood actuating
precipitation event. The degree of the soil saturation at this time decides
substantially over the fact whether the added precipitation can still infiltrate
to the soil or directly goes into aboveground discharge and leads to that too
strongly increased flood risk. An acquisition of the soil moisture dynamics in
high spatial distribution is not practicable with in situ measuring procedures.
Remote sensing approaches offer the possibility of a repeated contemporaneous
imaging of large space cutouts. The radar remote sensing, with which from an active,
mapping sensor electromagnetic waves will receive sent and the backscattered signals
from the target object, was tested intensively in the last years on its
possibilities of the representation of the soil moisture.
The image content of a radar dataset differs fundamentally from what is taken up
with optical systems. The radar backscattering signal depends apart from the
wavelength, the polarization and the angle of incidence of the sent waves
mainly on surface roughness and the dielectric characteristics the target surface.
A landscape cutout typical for river catchments are soil areas covered by vegetation.
Here the signal is substantially shaped of:
Thus the soil moisture is of one of the factors, which affect the signal. Its quantification can however occur even if succeeds determining the portion of the other factors to the signal.
| Identification of Band | Wavelength [cm] |
Frequency Range [MHz] |
|---|---|---|
| Ka | 0,75 -1,18 | 40.000 -26.500 |
| K | 1,18 -1,67 | 26.500 -18.000 |
| Ku | 1,67 -2,40 | 18.000 -12.500 |
| X | 2,40 -3,75 | 12.500 -8.000 |
| C | 3,75 -7,50 | 8.000 -4.000 |
| S | 7,50 -15,0 | 4.000 -2.000 |
| L | 15,0 -30,0 | 2.000 -1.000 |
| UHF | 30,0 -100,0 | 1.000 -300 |
| P | 77,0 -136,0 | 300 -230 |
In the project against this background
the
Microwave and Radar Institute of DLR will
accomplish a airborne SAR (synthetic aperture radar) measurement campaign with the
E-SAR system (experimental SAR). The goal of this campaign is the investigation of
the volumetric soil moisture in the upper decimeters needed for the operational flood
prediction. The determination of the volumetric soil moistures is tested for years
both at airborne and at satellite based radar systems. While for the soil moisture
estimation of open soil surfaces, which is affected essentially only by the surface
roughness of the soil, good results are obtained with RMSE of approximately
3.5 volume % since that time, the description of inventory geometry on vegetation
covered surfaces represents a strongly limiting factor for the present result quality.
Only by the technical advancement and use of the polarization during sending the waves
and the inclusion of the polarimetry into the analysis of the backscattering signals a
thrust toward the quantitative assessment happened also in the soil moisture
determination under vegetation. In this project the understanding of the parameters
raised by radar and wished by the hydrologist are extended, existing algorithms for
moisture estimation are tested and new developed, accuracy analyses accomplished and
borders and possibilities examined. Analyses for the influence of the vegetation on the
soil moisture acquisition and to possibilities for its reduction are located in the center.
The need of hydrologic models according to soil moisture input in high spatial
distribution from approximately 50 cm soil depth in usually vegetation covered
catchment areas demands the use of different wavelengths, viewing angles and polarizations.
In the campaign, which will take place in the Weißeritz catchment, four radar frequencies
(X -, C -, L -, P-band) are used. The table shows the wavelengths and frequency
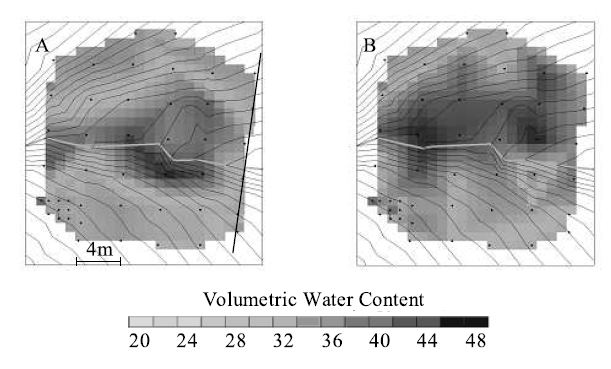
ranges of the bands, the figure clarifies the dependence of the signal penetration
depth into the soil of the frequency and the soil moisture. While with the X-band a
digital elevation model (DEM) for the investigation area is provided, SAR data are to
be taken up with the fully polarimetric C-band, L-band and P-band, which permit the use
of Pol-InSar methods.
Pol-InSar means the linkage of interferometry methods with polarimetry procedures. Interferometric data products are highly sensitive to the spatial variability of vertical structure parameters and allow accurate 3D localisation of the scattering center. Scattering polarimetry is sensitive to the shape, orientation and dielectric properties of scatterers and allows the identification and/or separation of scattering mechanisms of natural media. In Pol-InSAR both techniques are coherently combined to provide sensitivity to the vertical distribution of scattering mechanisms. Hence, it becomes possible to investigate the 3D structure of volume scatterers and to extract information about the underlying scattering processes using only a single frequency polarimetric radar sensor.
Last updated Dez 1 2006. Contact Information